Boot times are becoming a major hassle again to everyday users. NYTimes is reporting that many laptop vendors are resorting to a technology called SplashTop to boot a small Linux environment from BIOS, rather than incur a lengthy Vista boot penalty, documented in this New York Times video. This can save you a good deal of time if you need to write a quick email and turn the computer back off.
Of course, if you want anything outside the provisions of SplashTop, you'll have to boot into a different OS. SplashTop seems like the wrong solution to the right problem; if the full OS boots too slow, why boot a crippled OS rather than improve the full OS boot time? Thankfully, one of the release goals for Ubuntu 9.04 is faster boot time.
Bootchart is a great tool to record and chart relevant information about what resources are in demand during boot. Originally dreamed up and implemented by Fedora, it's quickly become a tool used by many.
Installation And Use On Ubuntu
The package name is bootchart; you can use your favorite command line or GUI package manager to install the package from main. By default it saves generated charts to /var/log/bootchart/, and will record one for every boot (except when booting in "profile" mode, which monitors disk access during boot to determine which files to read ahead).
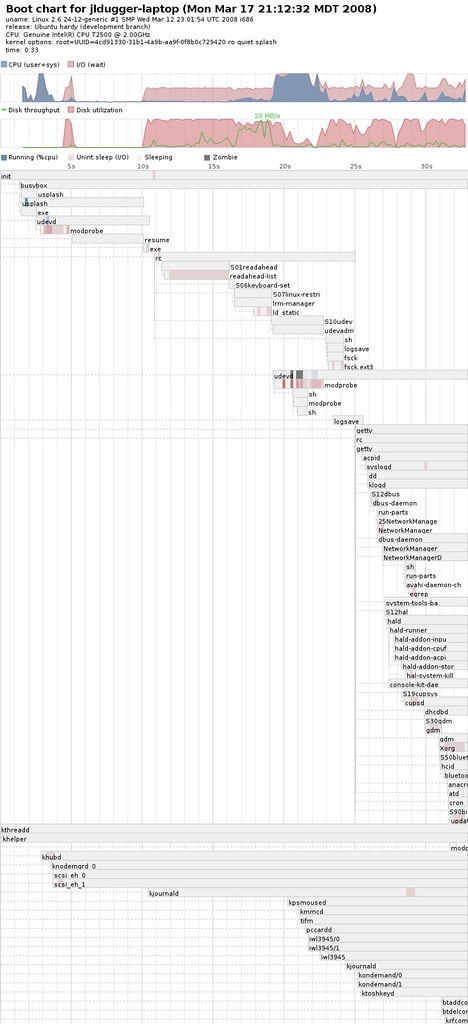
The chart itself contains 3 sections:
-
A description of the system
-
A pair of graphs describing CPU & iowait and disk activity/throughput during boot
-
A Gantt Chart showing long lived processes and their status: waiting for disk, running, sleeping or zombie
The most immediately useful purpose of bootchart is to objectively discover the boot time, and where the bottlenecks are. For example, this bootchart shows a length of 33 seconds, which isn't bad, but we can quickly discover a 5 second dead zone, with a suspicious process called "resume". We can also see that disk throughput peaks at 23MB/sec during readahead, but isn't sustained. Daniel Stone documents a similar series of diagnoses from 2004.
I happen to have a very large archive of bootcharts starting from Dapper forward one machine, and from Feisty forward on another. And if you've installed bootchart in the past, you might too. This can be useful to figure out when a drastic jump occured, and lead you to which changes to Ubuntu might have triggered it. You do risk wasting a lot of disk space, of course.
Secret features
Ubuntu comes with scripts to upload charts to a website (disabled by default). From /etc/init.d/stop-bootchart.d:
wget -O /dev/null -q --post-file $CHARTS/$base-$count.png http://bootchart.err.no/upload/$(lsb_release -si)/$(lsb_release -sc)/$(uname -r)/$(uname -m)/$boottype
Make sure you get permission from the owner or change that URL to a server you control before running it in this manner.
Bootchart can also record to SVGZ, a compressed vector image format. Bug reporters feel SVGZ is a lot smaller in practice, and reduces boot time on already long boots (Ironic!). SVGZ also has the advantage that with a bit of thought (ditch the XML comments and use sensible ID attributes instead) you could data mine a collection of charts. For example, you could graph the boot time over the course of six months, or calculate the ratio of time spent running readahead versus total boot time. A lazy survey of my October charts for Intrepid shows boot time has declined personally from 47 seconds to 34.
One slightly dangerous feature is that bootchart doesn't show all running processes:
Some processes were filtered out for clarity -- mostly sleepy kernel processes and the ones that only live for the duration of a single top sample. This skews the chart a bit but is definitely more comprehensible.
The dire future
Bootchart hasn't released since late 2005. A new developer unleashed a fury of 26 commits one day in August, but hasn't touched it since and hasn't announced any release. Some of the patches appear to fix bugs reported in Sourceforge but nobody's touched the bug since being reported, even to close them. There remain a number of open bug reports, but nobody seems to be reviewing reports or patches at this time. This is worrisome because a developer's ability to fix flaws is only as good as the tools available to objectively see them.
Given the goal of faster boot time, it seems unfortunate that a fundamental tool is currently without a functioning exchange for ideas, patches and bug reports. I hope one of the first actions taken on this track is to reform the bootchart project into a vibrant community of participants and observers from a plethora of projects. I'm finding discussions going on about bootchart on the edges of the open source community, but none at the theoretical center of activity. Collaboration is part of the Code of Conduct, and I hope our bright minds gathering at Mountain View in December take it to heart.
Comments !